Lead with business outcomes, not just tool lists.
Storyteller Using Data
I build analytics systems, forecasting models, and executive-ready dashboards that turn complex data into decisions teams can actually use.

Senior Placement Coordinator @ GIM
Current focus
A quick read on how my background evolved from scientific rigor into analytics, automation, and business-facing data strategy.
My path has been shaped by analytical discipline, operational execution, and strategic storytelling. That combination lets me move comfortably between raw data work and leadership conversations.
Started in Biotechnology, developing a core discipline for scientific rigor and meticulous data collection—the foundation for all successful analytical modeling.
Scaled into high-stake corporate analytics at WNS and Zunroof. Battle-tested through 58 months of managing global pipelines and delivering 40% efficiency gains via automation.
Currently synthesizing technical expertise with executive strategy at GIM. Leading as Senior Placement Coordinator while specializing in predictive modeling and Big Data architecture.
Career Journey
A cleaner view of the milestones behind the portfolio.
Start with the highest-signal work first, then browse the wider archive by tool and delivery format.
Storyteller Using Data
Use the filters to jump into ML, BI, SQL, and communication work without losing the overall narrative.
Architected a predictive model to forecast project completion rates across 15+ countries, identifying life-cycle bottlenecks.
Orchestrated the cleaning and validation of massive time-series datasets for infrastructure and pharma sectors.
Developed a robust framework for tracking Key Project Indicators and Risk Metrics for solar installation sales.
Predicting 3 months of item-level sales data across different store locations using ensemble machine learning methods.
Fine-tuned BERT for multi-class sentiment classification on social media data to track brand perception at scale.
Real-time fraud scoring using Isolation Forest and anomaly detection on high-velocity transaction data streams.
Ensemble demand forecasting combining Prophet and ARIMA models for enterprise supply chain planning.
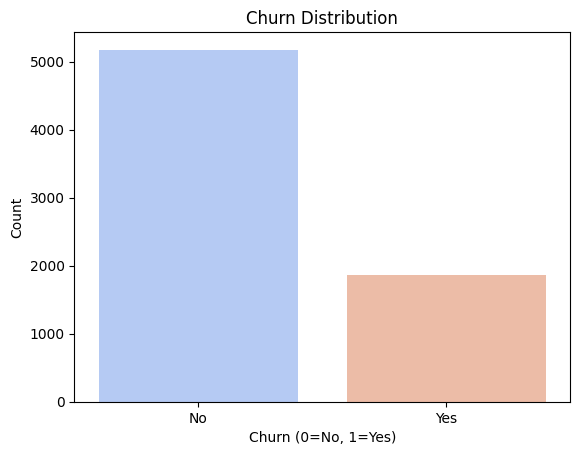
Flags at-risk employees 90 days early with 84% recall using Random Forest and SHAP explainability.
Dynamic pricing model with Gradient Boosting validated through a rigorous A/B testing framework.
CNN-based image classifier for quality control in manufacturing, deployed on Azure Vision at scale.
Scalable collaborative filtering recommender system running on distributed PySpark compute infrastructure.
Basel-compliant credit scorecard built with WoE binning, logistic regression, and Gini coefficient validation.
Real-time sales KPIs with drill-through pages, dynamic tooltips, and advanced DAX measures.
CFO-level P&L, EBITDA, and margin analysis dashboard connected live to Azure Synapse.
Headcount, attrition, engagement, and time-to-hire metrics tracked across all departments.
End-to-end supply chain visibility covering OTIF, lead time, inventory turns, and fill rate.
Multi-channel campaign attribution and ROAS tracking with GA4 and CRM data integration.
C-suite scorecard with automated threshold alerts and month-on-month variance commentary.
Real-time inventory dashboard with reorder point alerts and automated dead-stock identification.
RFM-based customer segmentation with Python-powered clustering visualised interactively in Power BI.
OEE, downtime, cycle time, and quality defect tracking connected to live IoT sensor data.
Budget variance analysis across all cost centres with automated commentary and drill-down.
Animated revenue trend analysis across regions with story-point narrative structure for executive presentations.
Multi-channel attribution funnel from awareness to conversion with GA4 integration and drop-off analysis.
Geo-spatial sales heatmap with territory drill-down and Mapbox integration for field sales teams.
Category-level profitability, sales mix, and margin analysis with parameter-driven views for merchandising.
Monthly cohort retention heatmap and churn curve analysis with Python-prepped data pipelines.
Visual dashboard of Apriori association rules showing product affinity by lift, confidence, and support.
KPI scoring, performance distribution, and ranking with privacy-safe aggregation across all departments.
Session, bounce rate, and conversion analytics blending GA4 data with CRM pipeline data.
Waterfall and bridge charts for margin decomposition across products and sales channels.
Market positioning vs competitor benchmarks using web-scraped and third-party industry data.
Kimball star-schema data warehouse design for a multi-channel retail analytics platform.
Unified customer view integrating 8 source systems via Azure Data Factory and dbt transformations.
IFRS-compliant financial data model with SSRS reports and parameterised stored procedures.
Achieved 70% query performance improvement via execution plan analysis and index strategy redesign.
Reusable T-SQL stored procedure library covering 50+ business operations with full error handling.
Index strategy redesign reducing average query execution time by 85% across production tables.
Automated DQ checks using SQL and dbt tests with alerting pipeline for critical data failures.
Zero-downtime migration of a 2TB SQL Server database to Azure SQL with full validation scripts.
Sub-second inventory query system for 500K SKUs using triggers and optimised stored procedures.
Multi-touch attribution model built entirely in SQL using window functions and recursive CTEs.
Three-statement financial model with DCF valuation, sensitivity tables, and scenario analysis.
Automated budget consolidation template for 15 departments with Power Query data refresh.
Dynamic KPI dashboard with 30+ metrics, interactive slicers, and conditional formatting alerts.
PMO-level portfolio tracker with automated Gantt chart, RAG status, and milestone alert system.
Multi-tier commission model with real-time calculation using Dynamic Arrays and XLOOKUP functions.
Integrated sensitivity model for investment decisions using Data Tables and Goal Seek automation.
Automated monthly reporting from raw ERP exports via Power Query transformation pipeline.
Workforce planning model across 12 departments with scenario-based headcount forecasting.
Product-level break-even analysis and contribution margin model with interactive visual output.
Rolling 12-month revenue forecast synced to actuals via Power Query with automated variance flags.
Annual strategy presentation for the C-suite and board with data-driven visual narrative and storytelling.
QBR deck with automated metric exports from Power BI and structured narrative insight commentary.
Storytelling-led deck presenting customer behaviour analysis to the marketing leadership team.
Series A pitch presentation with integrated financial projections, market sizing, and competitive analysis.
GTM strategy deck for new product line launch covering market research, positioning, and channel strategy.
Visual annual report with custom infographic design and key financial and strategic highlights.
Data-backed campaign proposal with ROI projections, channel mix recommendations, and budget breakdown.
As-is / to-be process analysis with swimlane diagrams and a prioritised improvement roadmap.
ML model results, business impact, and methodology communicated to non-technical senior leadership.
Monthly analytics summary with KPI snapshots and insight highlights tailored for business stakeholders.
End-to-end ML project documentation covering methodology, model cards, and deployment runbooks.
BRD template for data and analytics initiatives with stakeholder sign-off and scope definition structure.
Branded report templates for 6 business functions with automated styles, TOC generation, and formatting.
Enterprise data governance framework covering data ownership, lineage, quality standards, and compliance.
Data architecture and pipeline specification with system diagrams, data flow maps, and integration details.
Bridging the gap between model outputs and business understanding.
Read on Medium →From Jupyter notebooks to scalable, monitored, production-grade systems.
Read on Blog →A practical guide to choosing the right analytical tool.
Read on Medium →Performance tuning strategies that made a 10x difference in query speed.
Read on Blog →Scaling data processing workflows for enterprise environments.
Read on Medium →Making black-box models explainable for business stakeholders.
Read on Blog →Psychology-backed principles for effective data visualization.
Read on Medium →Choosing the right big data framework for your use case.
Read on Blog →Building and deploying predictive models in production environments.
Read on Medium →Implementing frameworks that balance innovation with compliance.
Read on Blog →Creating interactive, self-service analytics platforms.
Read on Medium →Reducing manual reporting effort by 90% through smart automation.
Read on Blog →How my biotech background helped me excel in data science.
Read on Medium →Evaluating trade-offs in cost, scalability, and support.
Read on Blog →Moving beyond p-values to make data-driven business decisions.
Read on Medium →Real-world case studies of database performance improvements.
Read on Blog →Implementing testing and validation for data pipelines.
Read on Medium →Evaluating cloud platforms for enterprise data infrastructure.
Read on Blog →Leveraging machine learning to surface actionable insights automatically.
Read on Medium →Architecture patterns for low-latency analytics at scale.
Read on Blog →Open to full-time roles, consulting engagements, and data collaborations. Let's turn your data challenges into strategic advantages.
Professional certifications across data science, analytics, and business intelligence.
Google & Coursera
2025
Coursera
2026
IBM
2025
IBM
2025
BCG
2024
Curated resources powering my growth in Data Science, AI/ML, and beyond.